Below you can find a link to the Week 15 Agenda. This will be updated as the week passes and at the end of the week a reflection will be shared in a different post.
Also, as a general resource, this is what my preliminary plan for this whole assessment will look like. (Things will certainly change as I see what my students need extra support with, but I find it really helpful to have a very general idea of how I might want to approach the whole task.)
This week brought about the end of the semester and moved us towards the end of the first assessment in Unit 2. Starting this week I felt like my students needed more practice constructing models and clarifying field lines, so we began the week by looking at iron filings and a magnet. The students had magnets and a sealed bag of filings and had to use both to try to model the magnetic field around one magnet and then when both were interacting. To give them some guidance I showed the groups a demo I have that shows the magnetic field of a magnet pretty clearly with just iron fillings.
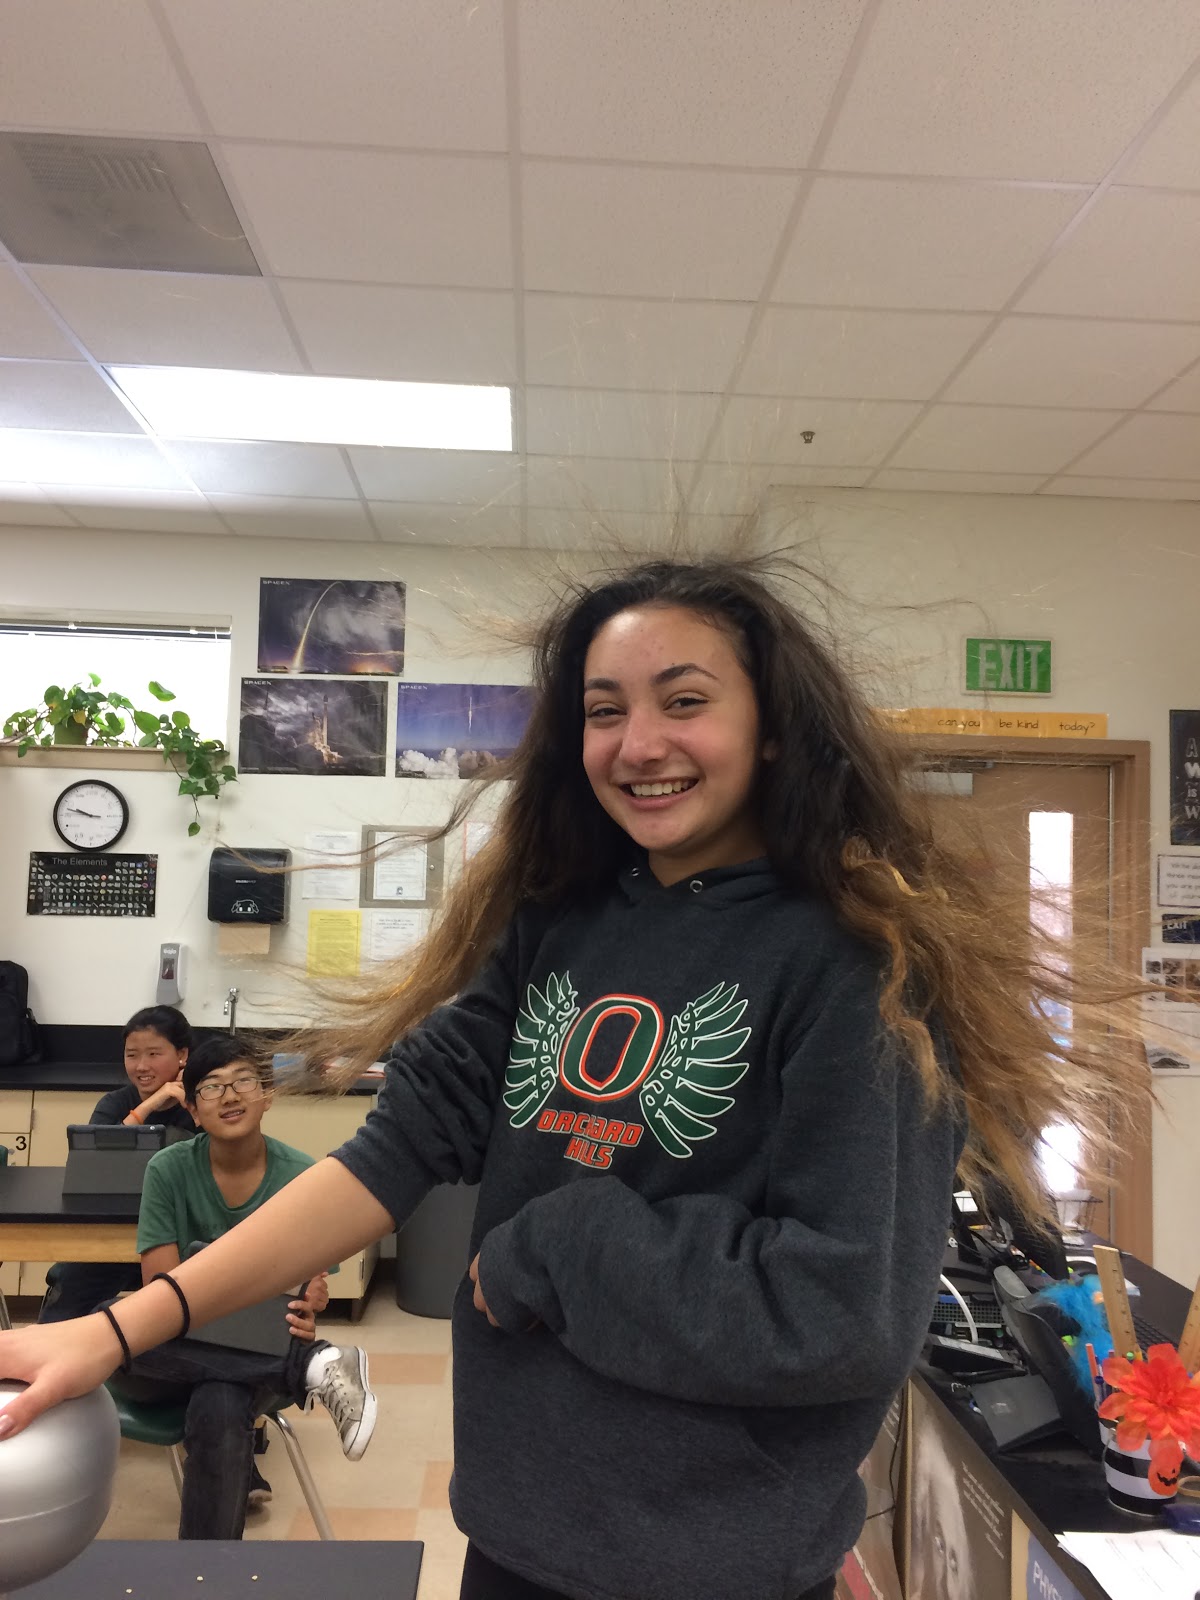
It is a plastic bottle, to which I added iron fillings. Then I glued a test tube to the top. To the test tube I added a cow magnet (which is the magnet I could find that best fits in the test tube). It is not a very strong magnet, but to show the field that tends to work best. I've tried a similar setup with a bar neodymium magnet with a 75lb pull and it worked, but the stronger pull made the field lines if anything less clear. We then moved onto the rotation lab, it went fairly well, though I could not get the balloon/plastic bag flyer activity to work, it would repel from the balloon, but would just either stick to my hand or fall the the ground. So, instead I replaced that on the worksheet with the Van de Graaff generator demo and had the students write about their observations with the generator. The actual demos I do with the generator are rice crispies on top (which fly off due to the buildup of negative charge in them), paper hair (which is just thin strips of paper tapped in the middle like the spokes of a wheel, this lets you both see repulsion and attraction when you bring the discharge wand close), and then student hair (I also have a wand with metallic strings that shows the same thing for students with short hair). All of the demos are the basic idea that like charges repel and opposite attract. While the demo is certainly not necessary, I think it is really worthwhile to include if there is the one time budget money for it. The supplies I use are: Van de Graaff Generator Discharge Wand Static Hair Wand
It is worth noting, for anyone that hasn't used a Van de Graaff Generator before that how well it works depends greatly on the weather that day.
We ended the week starting our models on how potential energy relates to the orientation and position of the objects, most importantly the distance between them. Continuing my thoughts at the start of the week, I felt like my students needed more support creating their models so I began the lesson going over what a model might look like for the plastic bottle magnet demo from the start of the week.
Ignore the end of the semester note the demo shared the board with, I don't have much white board space in my room.
This week brought with it the start of Unit 2, which I've been looking forward to since last year. Unit 1 meant a lot of basic physics with motion and forces. This new unit lets us get into some more interesting topics, starting with electricity and magnets. We started out the assessment creating a double bubble map about electric fields and magnets, it was a fine activity. The only real issue is the focus between the articles is not that similar so in comparing the differences some students focused more on the fact that a magnet is a thing and an electric field is a field, rather than topics like electric charges having a single polarity while magnets have two. I would like to find different articles for next year, or possibly just write something of my own for them to use.
Then we moved onto the electromagnet lab. I will admit to being a bit worried about this one, I've had my students explore electromagnets before, but I've never set it up so that I had to be ready with materials for 7 periods of students to make them. As a general background, I had my students work in table groups of around 4, while this could certainly be done with groups of 2 I felt like the larger groups helped the groups be successful as more students were involved to problem solve and think of idea to test. For the materials for the students I got: D Batteries (I was worried about how well these would last, but each of the batteries held out for the whole day so I have plenty left for next year) Electrical Tape (Helps hold down the wires to the end of the batteries and stop the students from getting shocked) Nails (I got a 5lb box of 10d 3" Galvanized Nails. I don't think the nails you get really matter, but you do want steel nails. This is enough nails to last forever, because there is no reason to not just keep using them) Sandpaper (The students need to sand off the insulation from the wire) Paper Clips (To test the strength, though really anything with steel, even other nails, would work) Wire (This is what I got from Amazon I gave each group about 4' and they were able to use it for all their different tests. I bought 2 rolls, but one was well more than enough. If you look closely the dimensions of the spool are not right on Amazon, this thing 3 inches high) The groups were generally very successful in getting their magnets to work.
For the groups that were not successful at first, their main problems were not sanding off the wire well enough, not attaching the wire to actual connection points of the battery, or just not having it taped down well enough. For some groups I helped them reattach the wire to the battery, for others just slightly pinching the tape to hold the electromagnet to the battery made it work. And with that I will have a caution. These get hot, we're not talking burn off your hand hot, but a bit unpleasant. It is actually mostly the battery itself that gets hot (and any uninsulated parts of the wire). As part of my instructions to my students I cautioned them to not touch the uninsulated parts of the wire and to only leave the electromagnet hooked up when they were actually testing to give it a chance to cool. The day after the testing was done I showed my students a video of three different electromagnets. I will note that there is always variation in how well the electromagnets perform based on just how good the connection is. (Enjoy the jolly music, it is my attempt to seem hip.)
This let us discuss what they should have observed, even if their electromagnets were not as successful or just not as consistent in how they performed.
Below you can find a link to the Week 14 Agenda. This will be updated as the week passes and at the end of the week a reflection will be shared in a different post.
With the end of last week we reached the end of unit 1. This first unit took a total of 12 weeks and had three parts. Given that there are about 38 weeks in the school year and 4 units, this is a pace that needs to increase. I think that is certainly achievable. The biggest challenge for me is that a quicker pace obviously means I need to be more efficient in grading as well. Pacing: Looking at the whole thing, as a general pacing we see three three parts taking the following amounts of time: First part: 4 Weeks Second part: 6 Weeks Third part: 2 Weeks I know I can shave a least a week from both of the first two assessments which would put me more on track with where I eventually need to be. Tracking Sheets I have been using the tracking sheets for the students to monitor their progress through the assessments. And while there are things I like about them, there are other things that just are not working. I would like the sheets to fulfill a way for students to reflect specifically on the SEPs. So I want to work those into it. The date tracking for the students just didn't work well because too many students didn't fill them out initially with the dates and couldn't remember when they completed parts. That being said, I am going to keep the sheets, just adapt them. They work well in helping the students see how the whole assessment goes together. Grading As a quick overview of what I am doing, our grades are set up on a 4 point scale. Although the numbers a bit different basically a 4 is an A, 3 B, 2 C, 1 D. In the gradebook the assessments are the majority of the grade. So, if a student got mastery on the first 3 parts of the assessment, but not the 4th, they would get a 3/4 on the assignment. Basically a point for each part. That is working fine. However, I am entering this into the gradebook as one grade (with comments saying what the student hasn't completed). Next semester I am going to break up the assessment into the 4 parts in the gradebook. I feel like it will give the students and parents quicker feedback on where they are and makes it clearer what still needs to be done. So, if a student finished just the first two parts (and I require mastery before they move on) they would have a 4/4 on each of those two parts and a 0/4 on the other two. Essentially this is the same grade as the combined score (just out of 4 times as many points). Now, I may decide this doesn't help, in which case it would be easy enough to combine it all back together into one grade. With grading as well, although I use rubric to give feedback and record scores on Google Classroom, the biggest help for me in being organized in tracking student progress has been the assessment record sheets where I mark off the student score for each part and highlight blue when they are done. It has made it very easy for me to see progress for each student at a glance. I will definitely continue doing that. Overall I am really happy with our move to NGSS. There is still a lot to learn, things to change, and time for more reflection. But the assessments are working well and I feel like my students are understanding the topics at a deeper level than before. While we have some supplemental activities and lessons, I've been very focused on mostly just working through the assessments. Now, I still have my doubts. I can put together a beautiful PowerPoint or Pear Deck, I can make a fairly engaging lecture, I can get good students to answer questions on a test with respectable levels of correctness. While we still have some Pear Deck lessons, we've moved away from all of that, things I felt very comfortable doing. There are times I wonder if I am still effective. But, I believe in our plan and I believe in student inquiry. While I will improve in implementing NGSS each year I know this is the right path.
This final assessment for Unit 3 was challenge for some of the students, unlike the earlier assessments where there really was ample time for all students to finish, for this one there was time for some students to finish the fourth part, but not for all. For those who didn't finish in class it became a homework assignment for them. While this was a challenge in its way, I think it reflects the quicker pace I feel like I need to for the assessments. Most won't be the quick two weeks this one was, but the time needs to be used more efficiently. Beyond the time, the last section of this assessment was a challenge because it was math heavy. I did what I could to support all the students by providing examples on the board and showing how even the more difficult calculation for speed is solved for each value the same exact way. If they could follow the procedure they could get it. Another challenge was in the graphing. The first two parts of the assessment involved working with real world data, and sometimes that can be hard to use. I believe that the benefit of working with this data was worthwhile, but it was a challenge. In a way, it would be easier to give the students real data that I know would give good results. Now, that being said, there is no reason the data shouldn't work, other than issues of scale with the wide range in masses. For the data from NASA they calculate the values using the equation for kinetic energy, so it should all line up. They take the magnitude (brightness), use that to estimate the size. They use the size and the average density of an asteroid to estimate the mass. Finally they take the mass and speed to find the energy. Basically the numbers should work. For my students who had graphs that didn't show a trend the issue tended to be mistakes in graphing, or mistakes in adjusting for scale. And finally, while my students could certainly tell you with certainty that more mass and more speed equal more energy, I am not 100% sure how well they know this for application. In looking at the answers for some students in the final assessment I felt like their answers came across as more of a practiced response, than some deep thought out analysis. Positives While that may sound like a lot of challenges, I did feel like this assessment went well. My students got the basic concept, the asteroid drop lab went well, and most students didn't seem overwhelmed by the math in the last part. While the challenges need to be remembered for next year, I don't know that I would specifically change anything for next year other than I might want to add some activity at the end to try to really assess their overall ability to apply this information in detail.
I went into this assessment intrigued with how my students would do compared to the first one. This assessment was mostly engineering challenges and labs (generally engaging), the last was a large research paper (not the most thrilling for all students...at least the writing part). OverallWhat intrigued me in the end was that overall, the classes didn't do dramatically better on this assignment in terms of overall score, but there were differnces. The paper was a really clear progression both through the task itself and through difficulty, what ended up is I had a number of students who scored low because it was difficult to get them engaged in the assignment. However, a lot of students were able to make it to the last part and successfully complete the paper. With this new assessment, which was focused on the engineering task of building the balloon powered car, almost all students finished the first two parts of the assessment, but fewer received a perfect score of 4 because the last two parts were more challenging. Looking at the whole assessment one of the successes was how the students did in choosing an investigative approach for the third task. They had to investigate both how balanced and unbalanced forces change motion and how mass changes motion. This is not an easy task to do. However, the students amazed me with the creativity of their approaches to the challenge. One of the challenges was the engineering design task itself. The students were engaged and all groups were ultimately successful in building a working car, but the whole process was new to me. Getting the groups to focus on all steps of the process was a challenge for me because it was new to me. I imagine this only gets easier as the process becomes more familiar. Grading I feel like as the year progresses I am getting more of a hang on the grading process. The structure of this assessment helped with one of my challenges last assessment, which was getting things graded quickly. Last assessment had some really quick parts which were hard to get graded before the students moved onto the next. For this assessment all the parts took more time. This made grading easier, though I am sure this will vary by assessment. What I Would Do Different
I wanted to try out wikiprojects with the first assessment for the engineering design process. While this worked for some students, the lack of structure meant that other groups who were less familiar with the process missed documenting steps. A Google Slides document with a page for each step of the process might help with this.
For the second activity with Newton's laws it went well, breaking it up by law per day seemed to work well. At the same time some students struggeled more than expected at making an annotated picture or really understanding what that is. I would want to clarify the expectation there more at the start of the assignment.
I am struggling with the tracking and monitoring sheet, it comes across to my students as something that is just a task, rather than something the are benefiting from. I understand its purpose and want something to fill the role, but I feel like that sheet is not working for me.
What I Would Do the Same
The ammount of materials provided for the car build seemed good. It was enough for any group to make a car, but still encouraged students to explore other materials and bring stuff from home. And I liked the challenge in general, making the car was achievable for all groups.
I also really like the Teacher Assessment Record sheet. It is working well to quickly motitor progress through the assessment for each student and takes little time to complete.
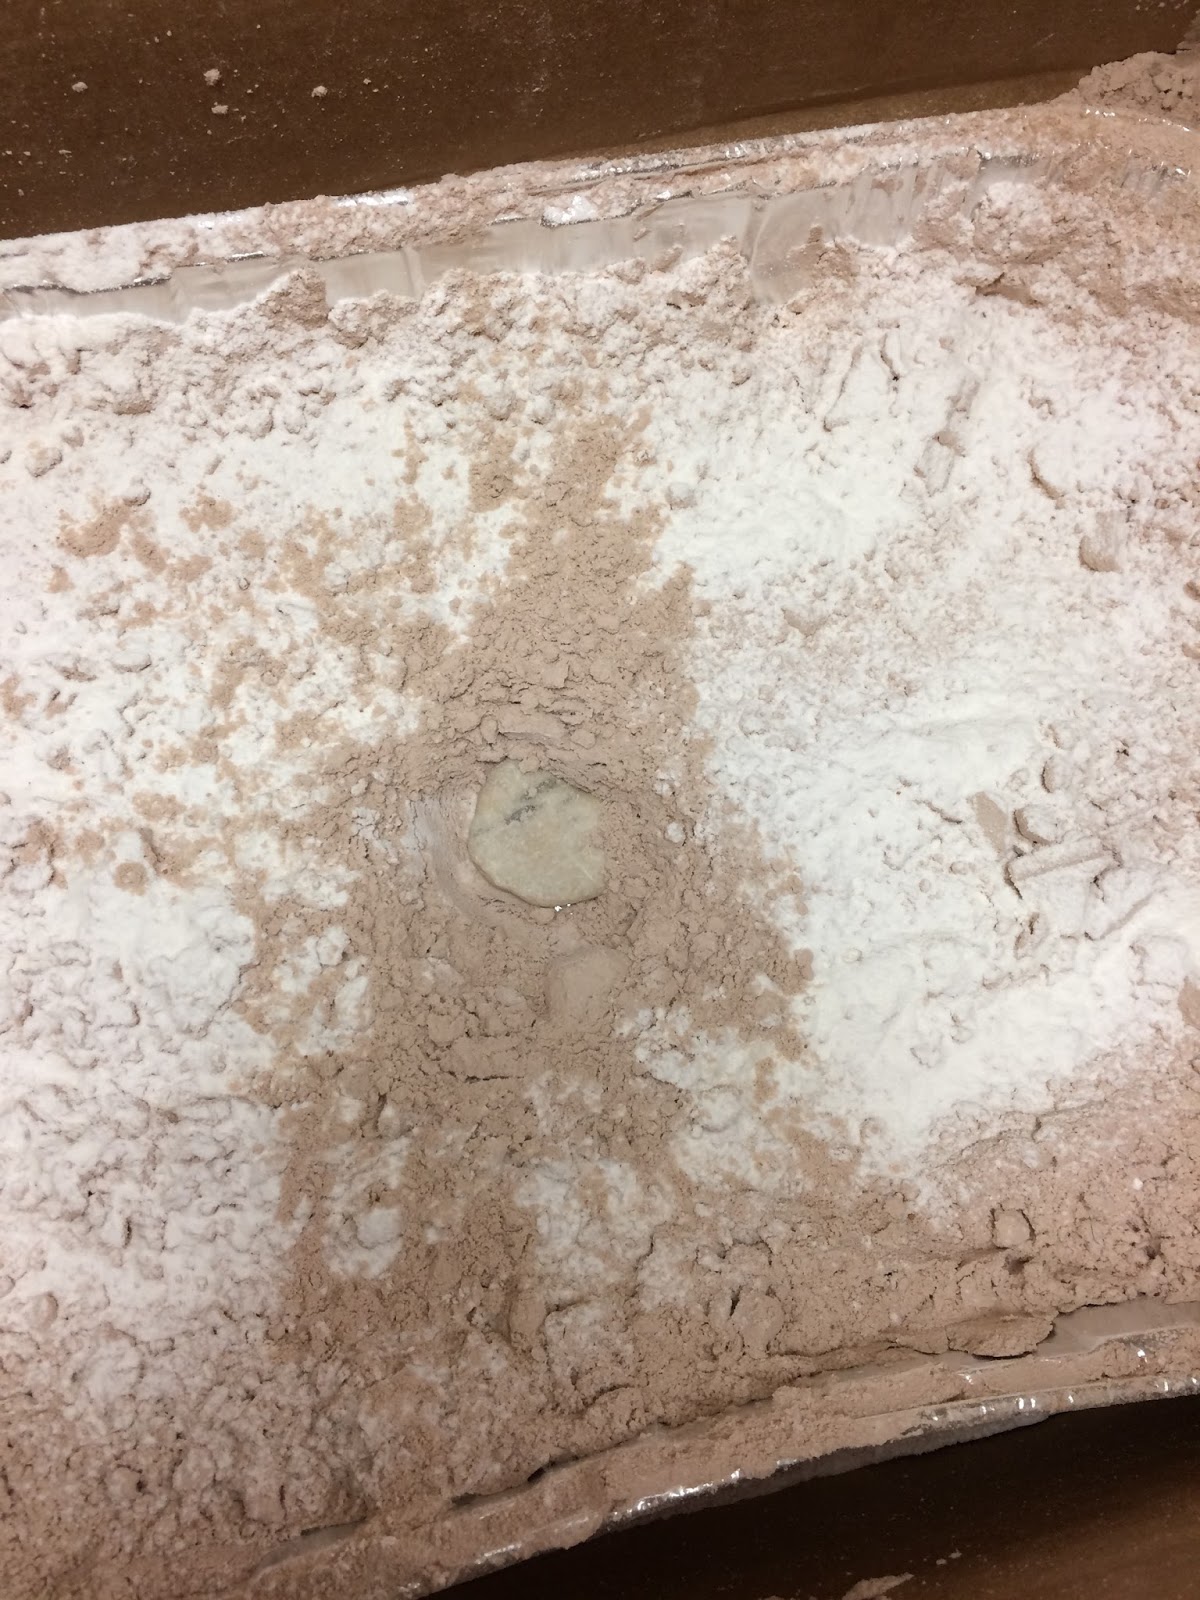
This week began the core of the third and last assessment for unit 1. I began by introducing the set up for lab. I explained that the pan would be half full our flour with a layer of cocoa on top and that they were to look at that impact to figure out how energy varied by mass and speed. I also explained why we were looking at heigh rather than speed, basically that speed is hard to measure, but when something is dropped from heigher up it will have more speed when it hits the surface. My students then worked on their hypothesis, figuring out what they would actually measure, and setting up their data tables. Asteroid Impact Lab:
I really wasn't sure how much material I would need. I have 7 class periods of 8th grade science and wasn't sure how much I could reuse the material (I also wanted enough that the other 8th grade teacher could use the material as well). I bought 4 10lb bags of flour, one thing of cocoa powder, and four trays. (In the end I needed more cocoa powder and had extra flour.) I mixed the cocoa powder about 1 to 1 with flour, this makes it easier to sift out over the surface and makes it last a bit longer. (With the cocoa powder it is worth noting that the color varies, the Hershey's was darker than the Koger one I got later.)
As seen in the pictures, I didn't worry too much in making sure the flour was perfectly covered, especially at the edges. I tested this at home and the impact was clear even without a perfect covering.
To make things stay a bit cleaner I had the students test with their pan in a cardboard box, this kept the flour that splashed out somewhat contained, rather than over my whole room. Above is an example of what the student results looked like for their mass trial. The ejecta is particularly apparent in that of the biggest rock, but is there for all of them. I had to make it clear to my students that they needed to pay attention to that white ejecta, not just the hole itself. (I showed the students this picture as an example to illustrate the point.) Below is an example of before and after one impact.
For my groups who didn't finish testing the first day (which was only because they had to share the pans so about 5 groups between all the classes ran out of time), I set up the second day using flour as the surface covering as seen below.
So the brown pattern around the rock is the ejecta from that impact. All together the lab went well, but it does have the potential to be messy or have students fool around with the pan. To help that I had the students keep the pans in the box. If I was more concerned about student misbehavior, possibly only having a couple pans at the front of the room that I would directly manage the whole time, could help with that. After the asteroid drop lab we moved onto the math heavy portion of the assessment with the conservation of energy investigation. The students collect some real world data on how more height = more energy and then work on representing conservation of energy on a falling object using math. For some of my students the math was easy, for most of them it was tricky. To help them out I modeled how we solve the problems to fill out the chart. If they can follow the steps all they need to do is plug in their own numbers to work through the problem.
As a run down of this math, they start by calculating gravitational potential energy. As the ball drops it would lose potential energy so they should see this number decrease to zero as they fill out the chart. The total energy would be the sum of the potential and kinetic energy, so they can find kinetic by subtracting the potential at that height from the total (which would be the potential energy before it falls). (As a note, the unit for energy is actually "x10^-3 N" because I didn't have them convert the grams into killograms. I felt like that made the math easier, but they certainly could convert the mass to kilograms.) They should see that the kinetic energy increases from 0 as they fill out the chart. To get speed they use the equation for kinetic energy and solve for speed, this is the part of the work that is tricky and I know I plan on giving partial credit for those who solve for potential and kinetic energy, but can't figure out speed. Since the initial kinetic energy and speed were zero I did a second example showing how to calculate speed of the kinetic energy was 20. They should see that the speed increases from 0, though the exponent doesn't give it the linear trend that we see in the other columns. While this last assessment is tricky for some, it is the last part of the assessment, so I don't expect all students to complete it. Plus, I feel it is important for the students to actually work with the equation to full understand how the variables change the measurement.
Below you can find a link to the Week 13 Agenda. This will be updated as the week passes and at the end of the week a reflection will be shared in a different post.
Also, as a general resource, this is what my preliminary plan for this whole assessment will look like. (Things will certainly change as I see what my students need extra support with, but I find it really helpful to have a very general idea of how I might want to approach the whole task.)
This assessment we are beginning is much quicker than the previous ones, which is a bit of a relief as both the research paper and the balloon powered car took some time to complete. While both of those two could be done quicker next year, they will still be somewhat time consuming. This assessment, on the other hand, will be completed by the end of next week. The first two parts of this assessment can be a slight challenge because they use real world data, depending on what asteroids the students pick the trends may be more or less obvious. I have some notes in italics to suggest ways to make the data easier for the student to work with. That being said, I didn't do this with my students, but just explained that the real world is sometimes not as clear as the data we might pick for them in class, most understood the trend even if it was less obvious in their graphs. We started the week looking at an image of the moon's surface, covered in impact scars. The students discussed this picture and the assumptions they could make from it and generally figured out that larger impacts meant more energy or more mass, so I knew that they data they would collect would only help support their previous understanding of the topic. Part 1 - (It is easier for the students to graph and see trends if you somewhat restrict the values for mass for the first data table so there is less range, this could be as simple as requiring them to only pick asteroids with a mass to the power of value of e6-e7. The other data table already restricts the mass values.) This part was easily done in a class period for most students. We discussed the notation briefly as the "e" for scientific is not familiar to them (though most already knew scientific notation from previous years). We also discussed as well as why there is the restriction to mass in the second graph (because it would overwhelm the difference in velocity). I gave the students a couple asteroids to look at that would work for the second part to get them started and then let them work. As it is not the most thrilling assignment, if student motivation is an issue, I could see giving them 10 asteroids they could use and then letting them find those asteroids and enter in that data. It still has them working with real data, but may be less tedious.
Below are some asteroids that can be used with values in the mass range for the second graph.
Note: The velocity is actually an exponential relationship, but the values are close enough that a linear graph works fine as well to show the relationship.
Part 2 - The first graph was also completed in a class period for most students. We began by discussing two things, graphing with scientific notation and how to spread out the numbers of a graph evenly. For both of these I began a partial graph for the Mass and Energy data to show how it should be set up and would look like. Even with the example I had more student questions than I normally do. That being said, once the students understood how to start with the graph, most were able to do it on their own. I also generally let my students work in groups to collaborate, this meant that a lot of questions were able to be answered or explained by peers who understood the approach to graphing more easily. Some students moved onto the second graph during the class period, but most needed more time. For a more detailed explanation, and I am sure there are other ways to approach the graph, I had my students start by eliminating up to 3 numbers if there were any that were much larger (by powers of ten) then the others. This helps make it so fewer numbers are clustered at the origin of the graph.
Then we converted the numbers to all be to the same power of 10 as the largest number. Say the largest number was 2.3e7 and my other numbers were 3.4e6 and 2.0e5, the first would become 0.34e7 and the second would become 0.02e7. I felt that leaving them in scientific notation was easier than graphing the numbers in standard notation as the number would be huge in the point in the assignment is not the scale, but rather the relationship.
Then the students found the difference between their largest and smallest number for each axis, divided that number by the number of boxes and used that to label the axis itself.
And then we graphed the points. I discussed outliers briefly, mostly because one of the top asteroids in the chart at that time (which a lot of students picked)had a very small velocity, so the number skews their trendline a bit. During the rest of the week I had my students explore an article on Actively Learn about how we can take sample from craters to better understand how the energy involved causes rock movement. Looking at their answers showed me that the idea of Conservation of Energy was not familiar to many of them, so we addressed that in the Pear Deck notes we did on Friday.
Below you can find a link to the Week 12 Agenda. This will be updated as the week passes and at the end of the week a reflection will be shared in a different post.
This week ended the second assessment, the balloon powered race car. It is hard to reflect in too much detail yet as I still need to finish grading the projects, but overall it went well. I feel like the students actual understanding of the laws of motion is much better this year compared to last year in terms of application. I imagine they would not do as well on a quick purely fact based multiple choice test, though, as we've not been practicing that as a skill. That is the main challenge with these assessments and NGSS in general. While I certainly don't think someone's success or lack of on a pop quiz is a good assessment of real understanding, there are some things that do end up needing to be explicitly taught, or at least explicitly taught to some students. The balance is figuring out which topics and facts they can discover, which they need some support on, and which need to be explicitly taught. The pre-assessment I did back in October gave me some initial thoughts about this and my hope is that the post-assessment I will do after this whole unit will help as well.
Given this week was the end of the assessment and the week before our two week break, we ended friday with a fun supplemental activity. The students used the stop motion app Koma Koma and Play-Doh to show how force and energy are related. They worked as a groups to make these and then presented them to the class with an explanation.
It was a successful supplemental activity in my books as it had the students working together to solve a tricky task (as most did not innately know how to show this relation). Plus, for those who struggle with science or have less general interest in it, the creative aspect let them be involved in the video creation even if they were not the one leading the idea. (You can see a couple of the videos here - minus student comments as they just explained them out loud to the class. Video 1 and Video 2.) We also had another supplemental activity this week, one on air resistance and gravity. As we get towards the end of the assessments I find that my students need more activities that let them step away from the assessment for a bit, basically they need a break. This activity is one I've done before and just modified to fit my expectations for it this year. I think the concept of object falling at the same speed (without air resistance) is important, but hadn't been covered yet this year, so this activity also gave me an opportunity to introduce that.


