Asteroid Impact Lab:


As seen in the pictures, I didn't worry too much in making sure the flour was perfectly covered, especially at the edges. I tested this at home and the impact was clear even without a perfect covering.
 To make things stay a bit cleaner I had the students test with their pan in a cardboard box, this kept the flour that splashed out somewhat contained, rather than over my whole room.
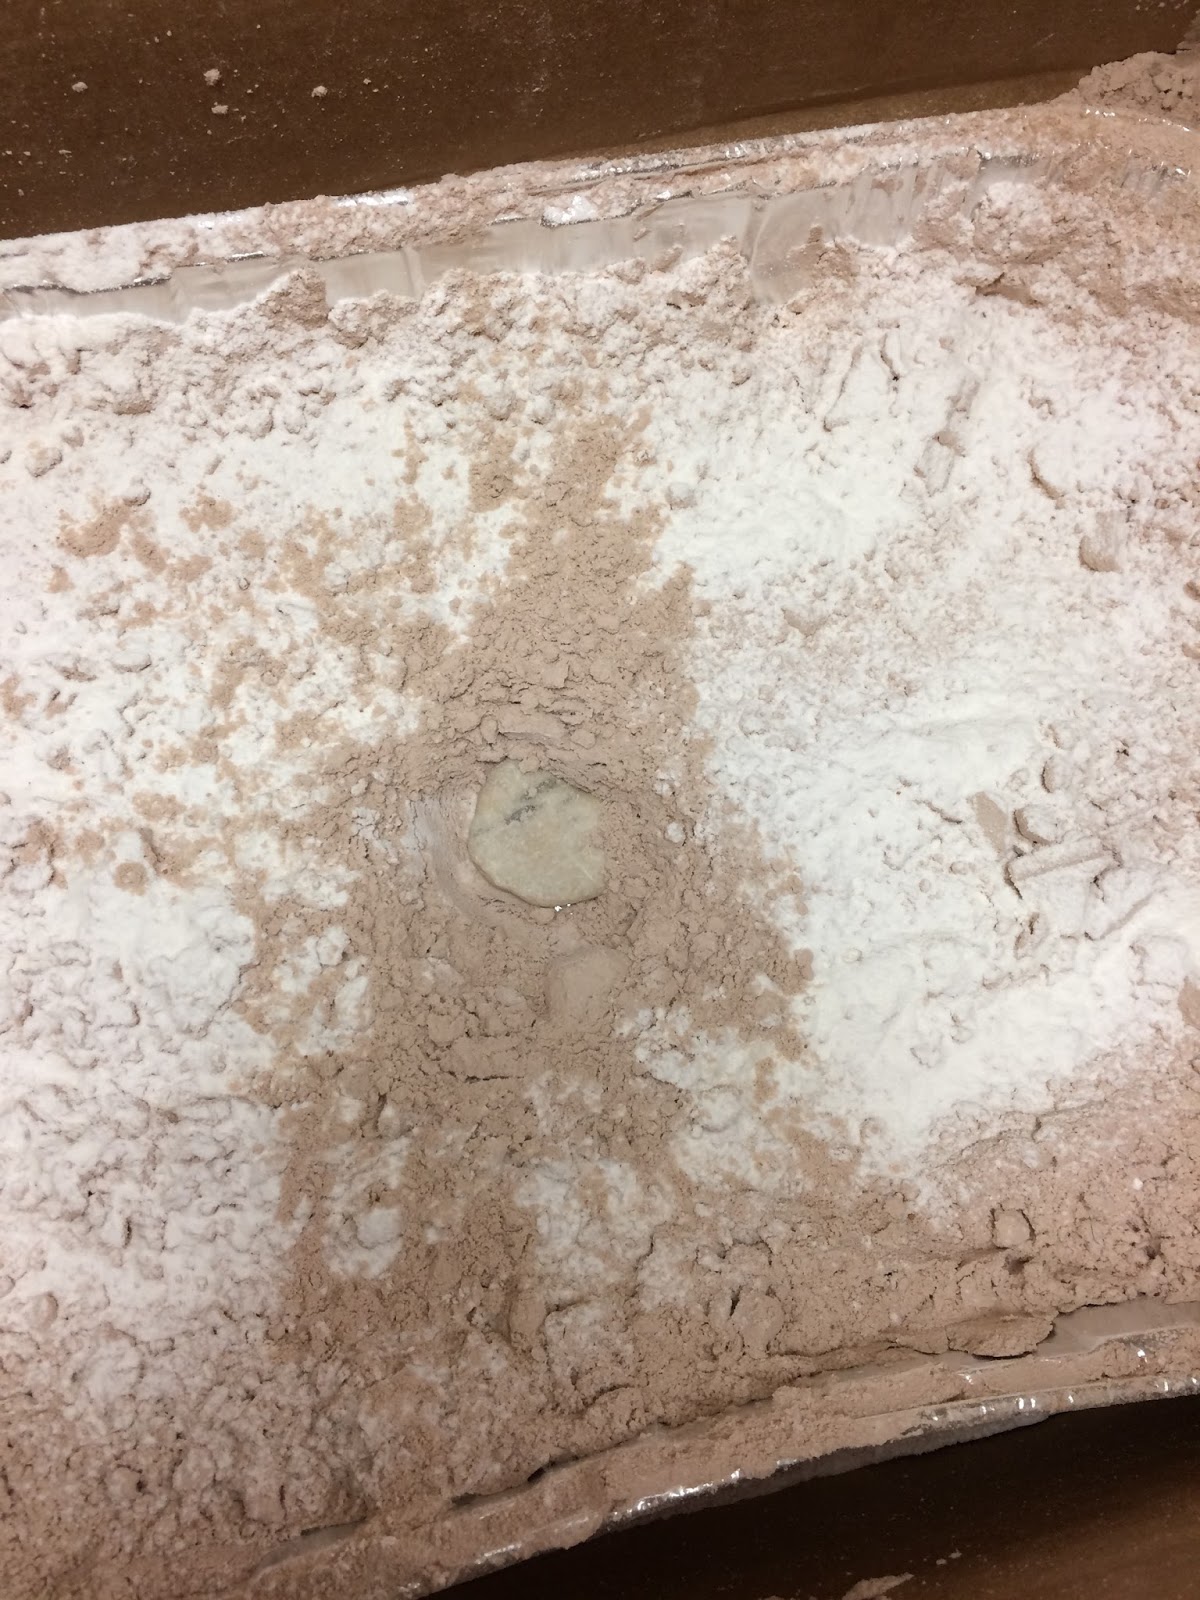
Above is an example of what the student results looked like for their mass trial. The ejecta is particularly apparent in that of the biggest rock, but is there for all of them. I had to make it clear to my students that they needed to pay attention to that white ejecta, not just the hole itself. (I showed the students this picture as an example to illustrate the point.) Below is an example of before and after one impact.


For my groups who didn't finish testing the first day (which was only because they had to share the pans so about 5 groups between all the classes ran out of time), I set up the second day using flour as the surface covering as seen below.
All together the lab went well, but it does have the potential to be messy or have students fool around with the pan. To help that I had the students keep the pans in the box. If I was more concerned about student misbehavior, possibly only having a couple pans at the front of the room that I would directly manage the whole time, could help with that.
After the asteroid drop lab we moved onto the math heavy portion of the assessment with the conservation of energy investigation. The students collect some real world data on how more height = more energy and then work on representing conservation of energy on a falling object using math.
For some of my students the math was easy, for most of them it was tricky. To help them out I modeled how we solve the problems to fill out the chart. If they can follow the steps all they need to do is plug in their own numbers to work through the problem.


As a run down of this math, they start by calculating gravitational potential energy. As the ball drops it would lose potential energy so they should see this number decrease to zero as they fill out the chart.
The total energy would be the sum of the potential and kinetic energy, so they can find kinetic by subtracting the potential at that height from the total (which would be the potential energy before it falls). (As a note, the unit for energy is actually "x10^-3 N" because I didn't have them convert the grams into killograms. I felt like that made the math easier, but they certainly could convert the mass to kilograms.) They should see that the kinetic energy increases from 0 as they fill out the chart.
To get speed they use the equation for kinetic energy and solve for speed, this is the part of the work that is tricky and I know I plan on giving partial credit for those who solve for potential and kinetic energy, but can't figure out speed. Since the initial kinetic energy and speed were zero I did a second example showing how to calculate speed of the kinetic energy was 20. They should see that the speed increases from 0, though the exponent doesn't give it the linear trend that we see in the other columns.
While this last assessment is tricky for some, it is the last part of the assessment, so I don't expect all students to complete it. Plus, I feel it is important for the students to actually work with the equation to full understand how the variables change the measurement.
No comments:
Post a Comment